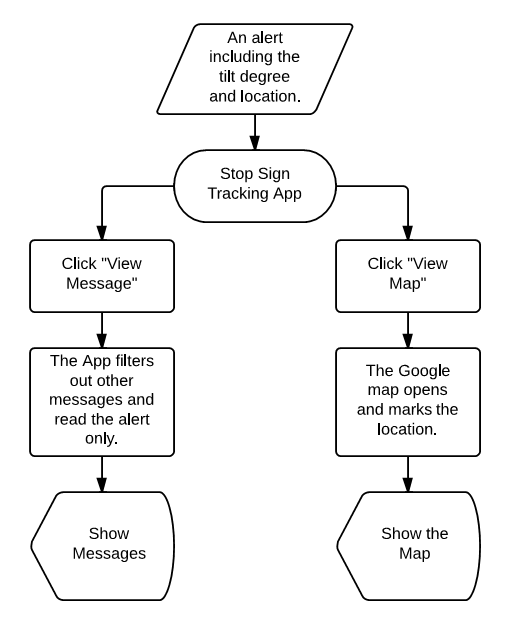
How the user interacts with the system.
1. Clients
First of all, our clients are people who are working at traffic departments, city or county office. One of their responsibilities is to check status of stop sign. If the stop sign falls down or is stolen, the user will be notified via text message.
2. Product Installation
We are using NEMA enclosure box type to contain our devices inside. NEMA is rated to protect against designated environmental conditions. A typical NEMA enclosure might be rated to provide protection against environmental hazards such as water, dust, oil or coolant or atmospheres containing corrosive agents such as acetylene or gasoline. We are going to put devices connected in NEMA box. There are usually four holes for screws to hold the box with high stability. Then we will use screws to connect NEMA box to the pole of the stop sign. The solar cell will be put on the top edge of stop sign for getting enough solar energy. The wire to solar cell will go into NEMA box so that it can supply power to each device.
3. Communication between Clients and Products
We are going to write the software so that once the modules are installed and powered on for the first time the system should self-calibrate. Once powered on the tilt sensor keeps checking the angle between stop sign and horizontal ground. The sensor will transmit the data to the microcontroller, which determines if the tilt has reached a predetermined tilt threshold of 30 degrees. Once the data reaches or exceeds this threshold, the microcontroller is going to control GSM module to send a text message to certain clients’ cell phones. There are two methods to monitor the status of stop signs.
a) Text message notification:
Before the product is installed, each GSM module will be programmed and be ready to send specific information including location of each devices with stop sign. Besides, more information like strength of wind, temperature can be edited. Then, the clients’ phones will be notified by a text alarm that contains location of the stop sign once stop signs tilted.
b) Android application interface:
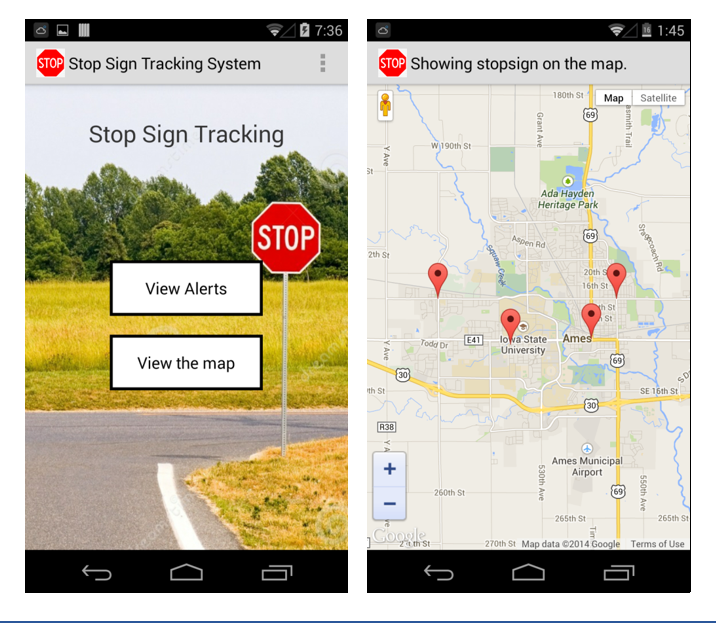
An android application is developed as a user interface. It is an easy way to view all alerts received by our client' cell phone. It can filter all alerts from many messages in cell phone's inbox. It can also show all issued stop signs on Google map at the same time, which is convenient to monitor the status of stop signs and collect data from cell phone.
First of all, our clients are people who are working at traffic departments, city or county office. One of their responsibilities is to check status of stop sign. If the stop sign falls down or is stolen, the user will be notified via text message.
2. Product Installation
We are using NEMA enclosure box type to contain our devices inside. NEMA is rated to protect against designated environmental conditions. A typical NEMA enclosure might be rated to provide protection against environmental hazards such as water, dust, oil or coolant or atmospheres containing corrosive agents such as acetylene or gasoline. We are going to put devices connected in NEMA box. There are usually four holes for screws to hold the box with high stability. Then we will use screws to connect NEMA box to the pole of the stop sign. The solar cell will be put on the top edge of stop sign for getting enough solar energy. The wire to solar cell will go into NEMA box so that it can supply power to each device.
3. Communication between Clients and Products
We are going to write the software so that once the modules are installed and powered on for the first time the system should self-calibrate. Once powered on the tilt sensor keeps checking the angle between stop sign and horizontal ground. The sensor will transmit the data to the microcontroller, which determines if the tilt has reached a predetermined tilt threshold of 30 degrees. Once the data reaches or exceeds this threshold, the microcontroller is going to control GSM module to send a text message to certain clients’ cell phones. There are two methods to monitor the status of stop signs.
a) Text message notification:
Before the product is installed, each GSM module will be programmed and be ready to send specific information including location of each devices with stop sign. Besides, more information like strength of wind, temperature can be edited. Then, the clients’ phones will be notified by a text alarm that contains location of the stop sign once stop signs tilted.
b) Android application interface:
An android application is developed as a user interface. It is an easy way to view all alerts received by our client' cell phone. It can filter all alerts from many messages in cell phone's inbox. It can also show all issued stop signs on Google map at the same time, which is convenient to monitor the status of stop signs and collect data from cell phone.
User Side: Cellphone Software Design
App Screen Shots
Testing Methods/Verification
For this project to be successful the device needs to function under Iowa weather. The device needs to be able to work during the hottest parts of the summer and the coldest days in the winter. The device needs to work properly through all-weather including snow and rain. To do this we need to perform some durability tests to make sure the device can function properly.
1. Temperature Test
For first Test we need measure is temperature, we will test the device in extreme cold and hot weather. Each part of the device has its own temperature range specified on their data sheets. The accelerometer has a temp range -40 to 85 °C, the GSM has a range from -30 to 70 °C with a max of -40 to 85 °C, and the Arduino pro (ATmega328) -40 to 85 °C. In Coover Hall, there are heating chambers in several of the hardware labs we plan on using the heat stations to test the heat range up to 120 degrees. Research showed that the highest recorded temperature in Iowa was 102 °F in 1988. And to test the cold we will use a freezer box up to test temperature at -35 degrees F. The lowest recorded temperature in Iowa was -28 °F in 1996.
We did both hot and cold testing in the temperature chambers found in Coover 2046. We tested both extremes hot and cold which provided a range of -22 F to 120 F. To conduct the tests we placed the device in the chamber and allowed the chamber to reach the desired temperature. While the device was in the chamber we printed data from the accelerometer out to the attached computer. We also turned the GPRS shield on and off. Once the chamber reached the desired temperature we kept it at that temperature for 5 minutes while monitoring the output. This test verified that the components that we have chosen will be able to withstand the typical weather found in Iowa.
2. Wind and Vibration Tests
To test the shock/ vibration and wind test we will use the labs in Howe Hall, Howe Hall has labs for mechanical vibrations, acoustics, and stress analysis. The average wind speed in Story county of Iowa is 21.21 mph another option is using a vibrating plate to measure the vibrations of the device and to see the after effects.
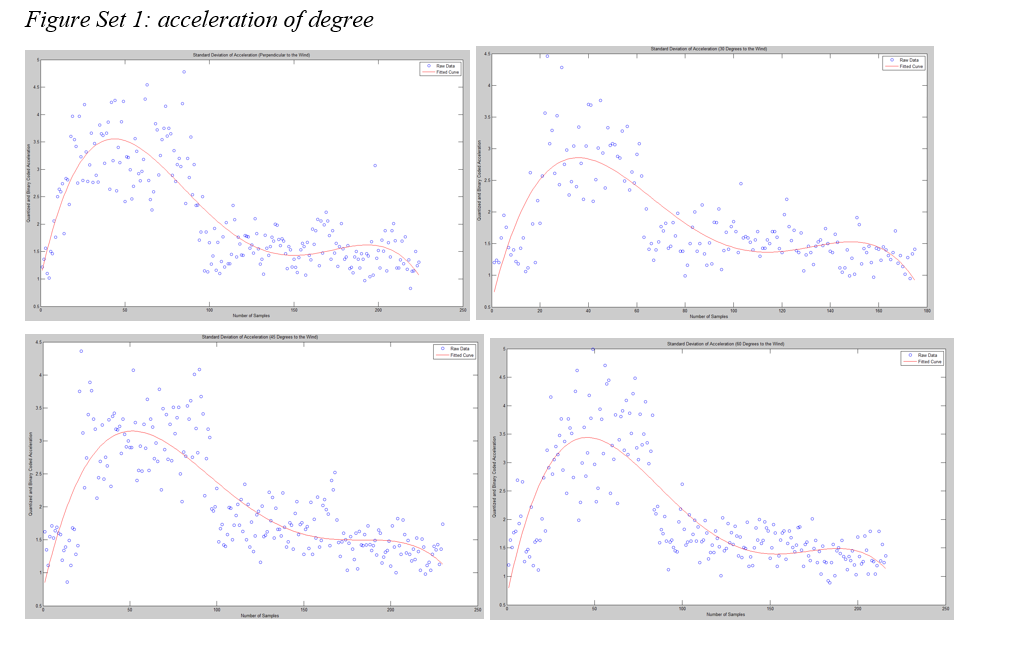
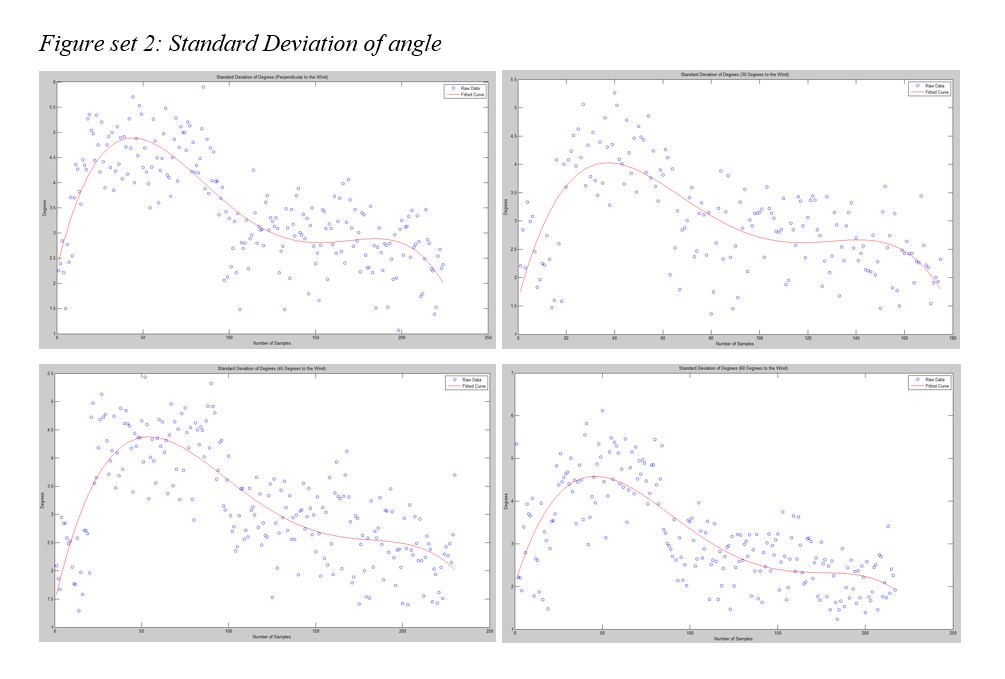
We were successfully able to gain access to the low-speed wind tunnel located in Howe Hall. We tested our system attached to a prototype set-up at three different wind-speeds and four different angles to the wind. We tested at wind speeds of 10 mph, 20 mph, and 30 mph and angles of 0, 30, 45, and 60 degrees. We were testing for average values returned by the accelerometer to correctly calibrate our embedded program according to the weather conditions being experienced. The general trend we observed was that at higher wind speeds the sign shook more and as the wind speed decreased the amount of shaking observed also decreased.
3. Water Test
To test the enclosure box to see if its water resistance we will place the enclosure outside in a rain storm. We will fill the enclosure with a water absorbent material. The enclosure was left out in a rain storm for 3 hours. Upon completion of the three hours the material was taken out. The material showed no signs of being exposed to moisture.
4. Cell Signal Reliability
To test the cell signal reliability we will measure the strength of the signal available at various locations. We want to find how reliable the signal available to the GPRS shield is. To test the signal the command “AT+CSQ?” was issued. The command returns a numerical value representative of the cell strength. The worst signal received was 25 which is still a very reliable signal. Overall the signal was consistently a strong signal available for use.
5. Accuracy of the Tilt Sensor and Calibration.
To accurately test the sensor we will manually perform adjustments to the stop sign tilting to 15 degrees, 30 degrees, 45, degrees, and knocking the sign down. We want to determine the reaction of the sensors and how it will detect changes to the sign.
6. Longevity of Power System
To test the longevity of the power system we will run the GSM and Arduino to max output to see how they function. The power supply can be tested to by using fluorescent light instead of sunlight to determine the max energy that is absorbed. The expected battery life is three days. To test the battery life we placed the system into shortest sleep cycle without the solar cell connected. We were able to verify that the battery was able to last the calculated three days.
1. Temperature Test
For first Test we need measure is temperature, we will test the device in extreme cold and hot weather. Each part of the device has its own temperature range specified on their data sheets. The accelerometer has a temp range -40 to 85 °C, the GSM has a range from -30 to 70 °C with a max of -40 to 85 °C, and the Arduino pro (ATmega328) -40 to 85 °C. In Coover Hall, there are heating chambers in several of the hardware labs we plan on using the heat stations to test the heat range up to 120 degrees. Research showed that the highest recorded temperature in Iowa was 102 °F in 1988. And to test the cold we will use a freezer box up to test temperature at -35 degrees F. The lowest recorded temperature in Iowa was -28 °F in 1996.
We did both hot and cold testing in the temperature chambers found in Coover 2046. We tested both extremes hot and cold which provided a range of -22 F to 120 F. To conduct the tests we placed the device in the chamber and allowed the chamber to reach the desired temperature. While the device was in the chamber we printed data from the accelerometer out to the attached computer. We also turned the GPRS shield on and off. Once the chamber reached the desired temperature we kept it at that temperature for 5 minutes while monitoring the output. This test verified that the components that we have chosen will be able to withstand the typical weather found in Iowa.
2. Wind and Vibration Tests
To test the shock/ vibration and wind test we will use the labs in Howe Hall, Howe Hall has labs for mechanical vibrations, acoustics, and stress analysis. The average wind speed in Story county of Iowa is 21.21 mph another option is using a vibrating plate to measure the vibrations of the device and to see the after effects.
We were successfully able to gain access to the low-speed wind tunnel located in Howe Hall. We tested our system attached to a prototype set-up at three different wind-speeds and four different angles to the wind. We tested at wind speeds of 10 mph, 20 mph, and 30 mph and angles of 0, 30, 45, and 60 degrees. We were testing for average values returned by the accelerometer to correctly calibrate our embedded program according to the weather conditions being experienced. The general trend we observed was that at higher wind speeds the sign shook more and as the wind speed decreased the amount of shaking observed also decreased.
3. Water Test
To test the enclosure box to see if its water resistance we will place the enclosure outside in a rain storm. We will fill the enclosure with a water absorbent material. The enclosure was left out in a rain storm for 3 hours. Upon completion of the three hours the material was taken out. The material showed no signs of being exposed to moisture.
4. Cell Signal Reliability
To test the cell signal reliability we will measure the strength of the signal available at various locations. We want to find how reliable the signal available to the GPRS shield is. To test the signal the command “AT+CSQ?” was issued. The command returns a numerical value representative of the cell strength. The worst signal received was 25 which is still a very reliable signal. Overall the signal was consistently a strong signal available for use.
5. Accuracy of the Tilt Sensor and Calibration.
To accurately test the sensor we will manually perform adjustments to the stop sign tilting to 15 degrees, 30 degrees, 45, degrees, and knocking the sign down. We want to determine the reaction of the sensors and how it will detect changes to the sign.
6. Longevity of Power System
To test the longevity of the power system we will run the GSM and Arduino to max output to see how they function. The power supply can be tested to by using fluorescent light instead of sunlight to determine the max energy that is absorbed. The expected battery life is three days. To test the battery life we placed the system into shortest sleep cycle without the solar cell connected. We were able to verify that the battery was able to last the calculated three days.